The NHL turns 100 soon. That means I have been reflecting a great deal on the past. And that has led to ‘ELO’ ratings for the National Hockey League. The ELO rating system is a method for comparing the relative skill level of competitors in one-on-one or team-on-team games. The system was invented by Arpad Elo, a physics professor, to rate chess players but has been adapted to apply to many other competitions. ELO is an elegant approach to rating competitors because it is simple and has a sound theoretical underpinning that matches the way humans think.
ELO is based on sound statistics, using a Bayesian approach to ratings. In Bayesian analysis we start with an initial view of probabilities (a ‘prior distribution’) and then adapt it by adding new data and determining a more informed view (the ‘posterior distribution’). This is powerful stuff and the way most people think. As an example, when two apparently equal teams (the prior view) compete, ELO (and the human mind) will nudge our view to believe that the winner of the contest was (now) the better team (the posterior view).
As a result, at any moment in time, ELO provides a Bayesian best estimate of team quality.
The ELO Model
ELO is based on limited number of inputs and parameters. A new ELO rating starts with the prior ELO ratings of the two competitors and changes the ratings based on the outcome of the game:
- The change in rating depends only on the final score of each game, where it was played (home ice advantage) and whether it was a regular season or playoff game.
- Teams always gain ELO points after winning games and lose ground after losing them. They gain more points for upset wins and for winning by wider margins.
- A tie is considered to be half a win and will cost the ELO-favourite some points.
- The system is zero-sum – teams trade points based on game outcomes. If Team A gains 5 points, Team B loses 5 points.
That’s all for the inputs. The art/science of the ratings change is where the heavy lifting occurs, but there are only a few parameters to select.
By convention the average rating is targeted at 1,500. In the chess world this means that an average club player would have a rating of 1,500. There would be 100 point players and, by extension many players above 2,500. In international football there are 500 point countries, and by extension some countries above 2,000, but the average country would be rated around 1,500. In professional tennis the top 20 players clear 2,000 ELO points. So, 1,500 just means average for the field.
It is the difference in the ratings of two competitors that matters, not the absolute ratings. In ELO, the expected outcome (probability of winning) for the home Team H (playing visiting Team V) is:

where ELOH and ELOV are the ELO ratings for teams H and V.
Home is an adjustment to account for home ice effects (see below). When at home, a team has a higher expectation of winning (and a lower one on the road), to reflect historically observed home ice advantage, so ELO adds some points to the home team (or subtracts them from the road team).
By construction, this formula means that a 100-point difference in ELO ratings implies that the favorite has a 64% chance of winning – 200 points implies 76%, 300 points implies 85%, 400 points implies 91%, and 500 points implies 95%. In elite professional team sports you see a lot of parity and/or randomness. So a 300 point spread (85% chance of the higher rated team winning) is really big.
Below is a translation table for hockey showing the rough equivalence of ELO ratings and other measures of team strength. Winning percentage and points are shown for an 82 game season (a) without the ‘loser point’ for overtime losses and (b) treating shootouts as ties. Goal differential is shown both for an 82 game season and per game, for an average scoring context of 6 goals per game.
The table shows that ELO differentials are not linear, but it does gives us a couple of rules of thumb: 50 ELO points is about 12 points in the standings or about 35 goals (in a 6 goal average per game context).
| ELO Rating | Winning Percentage | Points in Standings | Goal Differential | |
| Season | Per Game | |||
| 1,350 | 30% | 49 | -100 | -1.22 |
| 1,400 | 36% | 59 | -69 | -0.84 |
| 1,450 | 43% | 70 | -35 | -0.43 |
| 1,500 | 50% | 82 | 0 | 0.00 |
| 1,550 | 57% | 94 | 35 | 0.43 |
| 1,600 | 64% | 105 | 69 | 0.84 |
| 1,650 | 70% | 115 | 100 | 1.22 |
| 1,700 | 76% | 125 | 128 | 1.56 |
After a game is played, the change in the ELO rating of the home team is easy to compute:
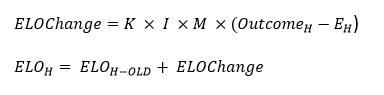
The math is the same for the visiting team, with the opposite sign because of symmetry in the formula.
The Parameters
- EH is defined above – the expected outcome of the game (the probability of a win for the home team). Note that EV = 1-EH.
- Home is set to 70 points through the 1982-83 season, 35 points after the 1997-98 season and interpolated in between. Through 1983 home teams won about 60% of all NHL games. More recently it has been about 55% and these home ice advantage factors correspond to these winning percentages. There are a number of reasons why home teams are favoured including travel, rink differences, rule advantages and crowd effects. It is hard to know what has caused the shift to a smaller home ice advantage, but it commenced around the time the NHL reintroduced regular season overtime.
- OutcomeH is 1 if the home team wins, 0 if it loses and 0.5 for a tie. In my work I have treated shootouts as ties (a) to be consistent over time, including in the playoffs, and (b) because shootouts look like exotic coin tosses that have no predictive power.
- K is the velocity of change. A high K says that we think that a single game adds a lot of information. A low K implies that a single game outcome adds little news. For the NHL I have used K=8. This somewhat higher than I expected to use but it resulted in the most predictive power in the model. In football and basketball a good K seems to be 20. In baseball it is more like 4. In international football K is set to 20 for ‘friendly’ matches.
- I is the importance of the game. I have used I=1.0 for regular season games and I=1.5 for playoff games. This conforms to the human view that games are more meaningful in the post-season. In international football this parameter varies by the importance of the match.
- M is the margin of victory factor. A high margin of victory gives ELO more information about the relative quality of the two teams. But we need to exercise caution. Once a game is won, the score becomes less meaningful. So M is designed to give increasing credit for higher winning margins but in a non-linear way. M is also designed to reflect expectations. A blowout is more likely for a heavily favoured team. Here is the formula for the home team:

Here GDH is the goal differential in the game, from the perspective of the home team. This formula is based on this goal differential, adjusted for the (roughly) expected goal differential. The adjustment is .85 goals for every 100 ELO points of differential. This adjustment is important for technical reasons. Once we have the absolute value of the adjusted goal differential, we take the natural logarithm to let some air out of larger margins. When the adjusted goal differential is between -1 and 1, the formula is designed so that the result is 1. M is larger when the adjusted goal differential is higher, but with diminishing returns for larger goal differentials.
Below are examples of the M factors:
| Goal Differential | Home Ice Adjusted Difference in ELO Ratings |
||||
| -70 | -35 | 0 | +35 | +70 | |
| -5 | 1.74 | 1.83 | 1.90 | 1.98 | 2.04 |
| -4 | 1.55 | 1.65 | 1.74 | 1.83 | 1.90 |
| -3 | 1.31 | 1.44 | 1.55 | 1.65 | 1.74 |
| -2 | 1.00 | 1.17 | 1.31 | 1.44 | 1.55 |
| -1 | 1.00 | 1.00 | 1.00 | 1.17 | 1.31 |
| 0 | 1.00 | 1.00 | 1.00 | 1.00 | 1.00 |
| 1 | 1.31 | 1.17 | 1.00 | 1.00 | 1.00 |
| 2 | 1.55 | 1.44 | 1.31 | 1.17 | 1.00 |
| 3 | 1.74 | 1.65 | 1.55 | 1.44 | 1.31 |
| 4 | 1.90 | 1.83 | 1.74 | 1.65 | 1.55 |
| 5 | 2.04 | 1.98 | 1.90 | 1.83 | 1.74 |
All this needed a fair bit of testing, the summary of which is that ELO expects that teams with a 100 point better (home ice adjusted) ELO rating will win 64% of the time, and they do.
Before jumping into the results we need to cover some other operational matters:
- Expansion teams are usually weak and have no prior rating. In my ELO model I assign a new team a rating of 1,400. This corresponds to a winning percentage of 36%, roughly what new teams have tended to achieve. Remember that, to the extent that this rating is wrong, ELO fixes this over time.
- The earliest years of the NHL needs different treatment. The original four NHL teams were assigned ELO ratings of 1,500. In addition, the NHL played western teams for the Stanley Cup for a brief period of time. Those teams were also assumed to have initial ELO ratings of 1,500.
- Teams change. In chess or tennis, the skill of the player develops continuously. In international football, team composition is fluid over time. But with season-based team sports, teams can and do exhibit material change in composition from season to season. To better fit ELO to the data I have adjusted ELO ratings, at the beginning of a new season, one third of the way towards 1,505. Absent expansion, my approach would trend the average ELO towards 1,505 rather than the target of 1,500. When expansion effects are considered the longer term average becomes more like the target.
- The game by game data was sourced from, and I want to thank profusely, the Hockey Summary Project.
The Results
With the methodology behind us we can now turn to the results. First of all, here is the ELO of every NHL team over all of time:

It looks a bit like a Jackson Pollock. You can play with the data, selecting teams, seasons and whether playoffs are included or not. Two other comments about the pretty picture before diving in to what this says:
- A team that moves or changes its name is not a new team. ELO remembers and carries along its history. In the graph above, teams are labelled based on their last location/name (e.g. NJD – born in Kansas City, relocated to Colorado and then settled on the east coast).
- At all times ELO is a point-estimate of team quality. The outlying points you see in the graph are just that … the outliers. These usually occur at the end of a season, just before ELO is adjusted towards the mean. The graph looks pretty jagged, because the time axis is so compressed. When we look closer at a single season, like 2016 (I refer to all seasons by their end date), it is much smoother:

How did ELO see 2016? ELO had Chicago entering the season with the highest rating –a carryover from their 2015 Stanley Cup win. But it didn’t take long for ELO to believe that Montreal was the NHL’s top team. They did, after all, have a terrific start. After some jockeying for position in early November, ELO identified the Rangers as the top team for a few weeks. In December it was Dallas, by a nose, until Washington emerged. The Capitals held the ELO crown through the end of March, challenged at first by Dallas, then the Blackhawks and then by the Ducks.
But ELO was watching the March of the Penguins, a 1,500 point team in January but the NHL’s top ranked team after the regular season and throughout almost all of the playoffs.
The long term graph makes it pretty clear that teams above 1,600 and below 1,400 are rare. The standard deviation of the ELO ratings is 54. This says that 95% of the ratings lie between 1,392 and 1,608 (winning percentages of 35% to 65%). ELO ratings became more dispersed after the great expansion of 1967 but have steadily become more clustered since then. In the last 20 years the standard deviation of ELO ratings is more like 44, implying that the NHL has more parity than ever.
Expansion teams commence with an ELO rating of 1,400. On balance these teams hovered around that level in their first season. The best expansion season ELO performance belongs to Buffalo. The Sabres finished their inaugural with an ELO of 1,451. Washington was the worst expansion team in history, recording the all-time lowest ELO of 1,221 in March of 1975. The Islanders, Sharks, Senators and Kansas City Scouts are the only other teams to ever sport an ELO rating below 1,300.
The Greatest Teams Ever
While the gold standard for ELO is 1,600 points, the platinum standard is a rating of 1,650 or more. Here are the only fifty five platinum seasons ever achieved:
1930 Bruins: The Boston Bruins were a 1925 expansion team that achieved averageness the following season and then took a major stride forward in 1929, winning their first Stanley Cup in a series with the Rangers. The following season they became the first NHL team to go platinum, on February 16, 1930, as they were driving towards a repeat championship. Boston had obliterated the league in the regular season, going 38-5-1, and entered the playoffs looking like the favourite. In the first round of the playoffs they achieved a peak ELO of 1,679, with back to back opening round wins against the Montreal Maroons, but lost in the best-of-three final to the Canadiens. After that upset, the NHL moved the finals to a best-of-five format!
1939-41 Bruins: Boston next appeared in a final in 1939, winning a best of seven set against the Maple Leafs to capture their second Stanley Cup. On March 26th of that year the Bruins reached a peak ELO rating of 1,668 with a 4-1 victory over the Rangers in the semi-final. In 1941 the Bruins were back above platinum, sweeping the Red Wings for their third Stanley Cup and achieving a peak ELO rating of 1,653.
1944-45 Canadiens: In 1944 the Montreal Canadiens took ‘platinum’ to another level. That team started the season with an ELO rating of 1,506. But by the end of the season Montreal became the first NHL team to clear 1,700 ELO points as they hoisted the Stanley Cup. After ELO’s offseason ratings haircut, they opened the 1945 season with a rating slightly below 1,650 and played around that level for the first half of the season. However they had a very hot run in the new year and peaked at a 1,700 ELO rating on February 17th 1945. However Montreal could not keep it together that season, losing in the semi-finals. The consolation prize was the 1946 Stanley Cup, won with an inferior team.
1952-55 Red Wings: The NHL’s pre-eminent team in the early 1950s was Detroit. After icing a strong team in 1948 and 1949, losing twice to the Maple Leafs in the final, the Red Wings surged to the front of the pack. In 1950 they won the first of four Stanley Cups over a six year period. How did ELO see this run? Detroit went platinum in 1952, reaching a peak ELO of 1,677 as they won the Cup and then again in 1955 as they were driving toward their fourth Cup of that era. From 1948 to 1956 the Red Wings played in seven Cup finals and won four Stanley Cups, going platinum twice.
Interlude: By comparison, the Montreal Canadiens won five consecutive Stanley Cups in the late 1950s, but never achieved an ELO rating higher than 1,641. They were clearly the dominant team of this period, but ELO shows us that this was mainly because other teams were generally clustered around average:

With parity at a pinnacle, we didn’t see another platinum team until 1969. Expansion ushered in an era of disparity in which 1,650 points was more achievable. This was not because of shooting fish in a barrel. ELO is smart enough to know that expansion teams are weak and so is a post-expansion league. ELO is less impressed by wins against weak teams. This is, however, a consequence of four factors:
- More teams mean more chances for teams to excel. A thirty team league is much more likely to have a platinum level performance than is a six team league.
- It is pretty clear that the dispersion of talent widened in the expansion era, increasing the chance of platinum play.
- Seasons have lengthened over time. Remember that ELO has an off-season ratings haircut that may be unfair to powerhouse teams. Longer seasons mean more information for ELO to assess team quality, and therefore higher peak values.
- Expansion also ushered in more playoff rounds. ELO likes playoff success. Two things account for this. The main one is that, when teams keep winning, ELO likes them more and more. Stanley Cup teams, by definition, win more games that they lose. ELO ratings increase for winning teams. And long playoff runs are really difficult to achieve. The secondary reason is the increased ‘importance’ of playoff games in the ELO method. This may seem arbitrary but is not. The playoffs are the games that matter. These are the games we remember. Most great teams achieve their ELO peaks late in the playoffs. Most of these teams were never platinum during the regular season.
1969 Canadiens: After over twenty years of league parity, the 1969 Canadiens were the first expansion-era team to go platinum, reaching 1,661 ELO points as they captured the Stanley Cup.
1970 Blackhawks: On April 12, 1970 the Hawks reached 1,650 ELO points before being dusted by the Bruins in the semi-finals.
1970-79 Bruins: For most of the 1970s Boston played at an exceptional level and four times in the early 1970s they reach a platinum ELO rating. The 1970 Bruins were a sub-1,600 point team until they found another gear in the playoffs and peaked at an ELO rating of 1,684, after a 12-2 run the playoffs. In 1971, Boston played much of the season with a platinum ELO rating and peaked at 1,695. But they stumbled in the first round of the playoffs and were upset by Montreal, the eventual champion. The Bruins reclaimed the Cup in 1972 with a peak ELO rating of 1,681. The Bruins did not win another Cup in the 1970s but they remained an exceptional team. The 1973 season was a struggle and the team finished the season with an unimpressive 1,554 ELO. But in 1974 they were again a dominant force, peaking at an ELO of 1,668, yet losing to the Flyers in a memorable final. Boston was a good team in 1975, 1976 and 1977 (with an oh-so-close peak ELO of 1,648) and then went platinum again in 1978 (1,685) and 1979 (1,660). So Boston reached platinum ELO six times in ten years. Unfortunately for the Bruins, they were the NHL’s second best team for much of that decade.
1972 Rangers: During the playoffs the Rangers touched platinum with a 1,651 ELO with a 3-2 victory over Boston in game 5 of the Stanley Cup final.
1974-76 Flyers: Philadelphia was a below average team through 1972, took a big step forward in 1973 and then turned into a powerhouse. Over the 1974-76 period they had a platinum three-peat. In 1974 they went head to head with another platinum level team, the Bruins, to win their first Stanley Cup and achieve a peak ELO rating of 1,659. Philadelphia repeated as champions the following season (peak ELO of 1,668) but ran into the Montreal buzz-saw in 1976, losing in the finals after reaching a peak ELO of 1,669. By the way, in 1977 their peak ELO was 1,648.
1973-82 Canadiens: After winning the 1969 Stanley Cup, Montreal struggled in 1970. For a period of time they looked downright average in 1971, but got hot in February, upset the Bruins and won the championship. In 1972 Montreal was a strong team (ELO generally around 1,600) but the Habs soared through 1973, ELO peaked at 1,683 and they won their third Stanley Cup in five years.
The 1974 season was a large disappointment and then Montreal got off to a poor start the following year – ELO was 1,501 on October 17, 1974. But this team got very hot and ELO peaked at 1,647 (not quite ‘platinum’) before losing to a very good Buffalo team in the semi-finals. ELO mechanically ‘regressed’ their rating in the off-season to less than 1,600, but they were unstoppable in 1976 and became the second team to clear 1,700 ELO points as they won their first of four consecutive Stanley Cups. The 1977 season was the pinnace for this team, starting the season over the platinum point of 1,650, playing the entire season above that level and then reaching the all-time ELO record of 1,768 points at the end of their playoff run. The next two seasons saw two more Stanley Cups and peak ELO ratings of 1,753 and 1,689 respectively. The Habs flirted with platinum again in 1980 and cleared it one more time in 1982 (reaching 1,659 ELO points). Here is a look at the development arc of that great team:

Montreal cleared 1,700 in three consecutive years and reached 1,750 twice. Remember, reaching 1,600 ELO points is a rare event. Playing consistently above that level, or around 1,650, for any period of time is truly remarkable.
To recap, over a 10 year period the Canadiens went platinum in six seasons and flirted twice with that level. They set an all-time ELO record and won five Stanley Cups.
1979 Rangers: During the playoffs the Rangers reached ELO of 1,660 but lost in the Stanley Cup final to Montreal.
1979-84 Islanders: The third and last NHL team to achieve the ‘double platinum’ level of 1,700 is the New York Islanders. This is also a case study of a pretty good expansion team:

They were a pretty bad team in their inaugural season but showed very strong improvement over the 1974 season. They had a breakthrough third season including a deep playoff run and an end-of-season ELO of 1,579. During the 1976 season the Islanders broke through the gold standard of 1,600 points. They chased platinum in the 1977 and 1978 and then went platinum in 1979 (reaching an ELO rating of 1,675).
The Islanders had a terrible start to the 1980 season and were a sub-1,500 ELO team in early March. But they got their act together, pushed just short of 1,650 ELO points and won their first of four consecutive Stanley Cups. In each of the next three seasons (1981, 1982 and 1983) they cleared 1,700 ELO points and won the Stanley Cup.
1983-88 Oilers: The next team to go platinum was the Edmonton Oilers. This another very successful ‘expansion’ team (the Oilers came into the league under slightly different terms than other new entrants – they had Gretzky). In 1981 this team was beginning to show signs of greatness with a first round upset on Montreal and a strong second round showing against the Islanders. Edmonton cleared 1,600 ELO points for the first time in 1982 and then went platinum in 1983. That season they peaked at 1,695 ELO points before being blown away by the Islanders in the final. That was Edmonton’s highest ELO ever, the beginning of six consecutive platinum seasons (an ELO record) in which they won four Stanley Cups. And then, in 1990, they flirted with platinum and won their last championship:

1985 Flyers: Philadelphia achieved an ELO rating of 1,663, before being run over by Edmonton in the finals.
1989 Canadiens: The Habs looked like a powerhouse and again flirted with an ELO rating of 1,700, achieving a peak ELO of 1,694 with a double overtime win in game three of the Stanley Cup final. But they then dropped three in a row.
1989 Flames: Calgary peaked with an ELO of 1,686 as they won the 1989 Stanley Cup in that thrilling series with the Habs.
1992-93 Penguins: Pittsburgh won their first Stanley Cup in 1991 with an ELO of 1,637 and then reached platinum ELO ratings of 1,660 and 1,659 in each of next two seasons, winning another Cup but being upset in round two of the 1993 playoffs.
1994 Rangers: New York pops up again with an ELO of 1,653 as they closed out their Stanley Cup victory over Vancouver.
1995 Devils: In New Jersey’s Stanley Cup win over the Red Wings, the Devils peaked at an ELO of 1,674.
1996 Avalanche: After upsetting Detroit, and stealing some ELO points from them, in the Western Conference final, the Avalanche completed a four game sweep of the Panthers to win the Cup and finish with an ELO rating of 1,658.
1996-98 Red Wings: In 1996 Detroit peaked near the platinum line, reaching an ELO of 1,693 on March 31st. They entered the playoffs as the top seed in the West but struggled a bit with lesser teams and then dropped the conference final to Colorado. However, the Red Wings followed this up with back to back Stanley Cups in 1997 and 1998, reaching peak ELO ratings of 1,659 and 1,663 in those two seasons.
2001 Avalanche: Colorado won their second Stanley Cup in 2001, reaching an ELO rating of 1,656 in the process.
2002 Red Wings: As they won the Cup they peaked at an ELO rating of 1,651.
2007 Ducks: Anaheim won their first Stanley Cup with a peak ELO rating of 1,658.
2007 Senators: ELO thought Ottawa was the Stanley Cup favourite (an ELO of 1,659 on May 14th), but the Ducks had an impressive 4-1 win in the final.
2008-09 Red Wings: Detroit won the 2008 Stanley Cup (peak ELO of 1,655). Their ELO rating peaked at 1,652 in May of 2009 but they lost a memorable seven game final to the Penguins.
2012 Kings: Los Angeles achieved a peak ELO rating of 1,663 as they won their first Stanley Cup.
That’s it folks. These are the fifteen teams to ever break through to the platinum level, and the fifty five seasons in which they did it. The most consecutive platinum seasons was six by the Edmonton Oilers (1983-88). Montreal ran four in a row (1976-79) and set an ELO record of 1,768 in that era. The Bruins (1970-72), Flyers (1974-76), Islanders (1981-83) and Red Wings (1996-98) each had three-peat platinum seasons. The only other repeat platinum seasons came from Montreal (1944-45), Pittsburgh (1992-93) and Detroit (2008-09) . Most teams that reached platinum did so on their way to the Stanley Cup. But a few did not. That’s the nature of the game.
Conclusion
To close, let’s look at the leaders in silverware.
Montreal has won 23 Stanley Cups. I have already looked at them in their seminal 1970s years. And I reflected a bit on their better-than-the-pack dominance in the 1950s (the 1944-45 Canadiens were a better team). Here is the full history of the Habs:

The Maple Leafs are number two in Cups with 13. All famously before 1968. But the Leafs are the only ‘original six’ team to have never achieved a platinum rating. Best Toronto team ever? The 1948 edition with a 1,636 ELO (1951 was nearly as good):

The Red Wings have 11 Stanley Cups. Their highest ELO ever came in 1996, just before they disappointed in the playoffs. They were clearly a dominant team in recent history, during an era when that was very tough to be:
